There’s a lot of AI emerging in conservation. I’ll set my cards on the table. I think that AI has much to offer in conservation… but only if the models are adequately trained. And that’s a bit of a challenge.
To set a context, the models that we use outside conservation might be trained on billions or even trillions of data points. So identifying a car, a train, a cat or a window… those are well-trained models (because every time you’ve done a Captcha, that’s what you’ve been doing!). But identifying a mouse, a rat, a stoat, a kea, a kiwi… not so many training data sets. a million training points perhaps? Certainly not a billion!
The other challenge in conservation is that as AI gets added to devices like traps and cameras in the field, the AI chip has a tiny power budget… and so the model simply isn’t as powerful. When a model is running on Amazon Web Service, power isn’t an issue so the AI results should be better. When the model is running on a chip with a mA power budget, not so much.
We have a bunch of AI-enabled technology - bird monitors, trail cams and of course our AT520-AI traps. So how good is the AI? Subjectively, I had a feeling that there’s room for improvement. Objectively, I needed a metric. And that’s what this post is about.
What I’ve done is take 2,500 images (or bird song recordings… but that’s more difficult and out of scope for this). So for the 80 AT520-AI traps in our core trapping areas, that’s about five days of data. For each image, the AI has done its classification (nothing, rodent, possum, cat etc). I then review each image and then put my classification in. I hasten to add that I’m fair in this assessment. An AI image classifier has no context. It knows nothing of prior images, nothing of scale, nothing about trap architecture. So I assess realistically.
The end result is a matrix like this:
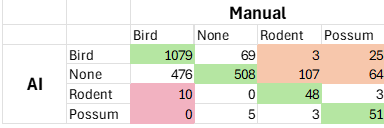
Column 2 is what the AI saw - Row 2 is what I saw. Where we agreed are green cells with the totals against each species.
The orange cells show where the AI either saw a bird or nothing… but there was a predator there. That’s bad because that’s an opportunity lost to kill the predator. (Noting that the majority of the possum errors were a dead possum under the kill bar!)
The red cells are worse. That where the AI ‘saw’ a rodent but it was a bird (invariably a waxeye in our traps). That would be a dead bird. So not good.
Overall the green cells represent 67% - so the AI got it right 67% of the time. For monitoring, that’s not bad. For trap control, there’s some improvement needed.
(I do need to set an important context. Motupohue is a low-predator environment and so we have a LOT of birds (predominantly waxeyes) feeding in our AT520s… a lot of mice, some rats, fewer possums. If we were in an early-stage control environment I suspect the results would be better)
This is probably an approach that others might find useful for assessing ‘your’ AI. Share your results - I’d be real interested to hear your results.
We’re going to now use this approach to assess past performance from a year ago when we first started with the AT520s… and then do this every time a new model is released so that we can confirm improvement.
I hope this helps
David