Hacking the "Trap sub type" field

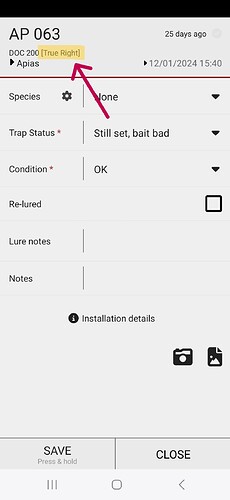
If you don’t currently use the “Trap sub type” field you may be unaware that it shows up clearly with each trap when displayed on the app. You can use this field for any sort of useful information that a trapper may like to know - not just as a sub type. It won’t affect the behaviour of the app with respect to each trap.

For instance, on one of the projects we help with, this field is used to indicate whether a trap can be found on the true right or true left of a river.

1 Like

import numpy as np
import matplotlib.pyplot as plt

def create_forest(rows, cols, pest_ratios):
“”“Create a forest with pests based on specified ratios.”“”
forest = np.zeros((rows, cols))
total_cells = rows * cols

for pest_type, ratio in pest_ratios.items():
    num_pests = int(total_cells * ratio)
    pest_locations = np.random.choice(total_cells, num_pests, replace=False)
    for loc in pest_locations:
        row, col = divmod(loc, cols)
        forest[row, col] = pest_type

return forest

def highlight_trap(ax, trap_loc, trap_size):
“”“Highlight a trap on the plot.”“”
trap_row, trap_col = trap_loc
trap_range = trap_size // 2
rect = plt.Rectangle((trap_col - trap_range - 0.5, trap_row - trap_range - 0.5),
trap_size, trap_size, linewidth=2, edgecolor=‘red’, facecolor=‘none’)
ax.add_patch(rect)

def draw_best_trap(ax, trap_loc, trap_size):
“”“Draw the best trap.”“”
trap_row, trap_col = trap_loc
trap_size_half = trap_size // 2

for row in range(trap_row - trap_size_half, trap_row + trap_size_half + 1):
    for col in range(trap_col - trap_size_half, trap_col + trap_size_half + 1):
        if 0 <= row < forest.shape[0] and 0 <= col < forest.shape[1]:
            ax.text(col, row, 'X', color='red', fontsize=12, ha='center', va='center', fontweight='bold')
        else:
            print(' ', end='')
    print()

def plot_forest(ax, forest, trap_locations, trap_size, caught_pests=None, title=‘Forest Scenario’, cmap=‘tab10’, geofence_radius=3):
“”“Plot the forest using Matplotlib.”“”
ax.imshow(forest, cmap=cmap, interpolation=‘nearest’)
ax.set_title(title)
ax.set_xlabel(‘Columns’)
ax.set_ylabel(‘Rows’)

# Add legend
legend_labels = {1: 'Possum', 2: 'Rat', 3: 'Stoat'}
legend_elements = {i: plt.Line2D([0], [0], marker='o', color='w', markerfacecolor=plt.cm.tab10(i),
                                 markersize=10, label=legend_labels[i]) for i in legend_labels.keys()}

ax.legend(handles=legend_elements.values(), title='Pest Types')

# Highlight traps
for trap_loc in trap_locations:
    highlight_trap(ax, trap_loc, trap_size)

# Highlight caught pests
if caught_pests is not None:
    for row in range(forest.shape[0]):
        for col in range(forest.shape[1]):
            if caught_pests[row, col] == 1:  # Caught possum
                ax.text(col, row, 'X', color='blue', fontsize=12, ha='center', va='center', rotation=45)
            elif caught_pests[row, col] == 2:  # Caught rat
                ax.text(col, row, 'X', color='green', fontsize=12, ha='center', va='center', rotation=-45)
            elif caught_pests[row, col] == 3:  # Caught stoat
                ax.text(col, row, 'X', color='purple', fontsize=12, ha='center', va='center')

# Add geofence around the area with false traps
for trap_loc in trap_locations:
    geofence_circle = plt.Circle((trap_loc[1], trap_loc[0]), geofence_radius, fill=False, edgecolor='orange', linestyle='dashed')
    ax.add_patch(geofence_circle)

# Draw the trap
for trap_loc in trap_locations:
    draw_best_trap(ax, trap_loc, trap_size)

Set simulation parameters

rows, cols = 20, 20
pest_ratios = {1: 0.05, 2: 0.02, 3: 0.01} # 1: Possum, 2: Rat, 3: Stoat
trap_size = 5
radam_freq = 0.8 # Probability of trapping with random frequency (adjust as needed)

Create the initial forest based on specified ratios

initial_forest = create_forest(rows, cols, pest_ratios)

Set trap locations for different views

trap_locations_1 = [(5, 5), (15, 15)]
trap_locations_2 = [(10, 5), (5, 15)]
trap_locations_3 = [(15, 5), (10, 15)]

Plot different views

fig, axes = plt.subplots(nrows=2, ncols=2, figsize=(12, 12))

Initial view

plot_forest(axes[0, 0], initial_forest, trap_locations=[], trap_size=trap_size, title=‘Initial Forest Scenario’)

View 1

caught_pests_1 = catch_pests(initial_forest, trap_locations_1, trap_size, radam_freq)
plot_forest(axes[0, 1], initial_forest, trap_locations_1, trap_size, caught_pests_1, title=‘View 1’)

View 2

caught_pests_2 = catch_pests(initial_forest, trap_locations_2, trap_size, radam_freq)
plot_forest(axes[1, 0], initial_forest, trap_locations_2, trap_size, caught_pests_2, title=‘View 2’)

View 3

caught_pests_3 = catch_pests(initial_forest, trap_locations_3, trap_size, radam_freq)
plot_forest(axes[1, 1], initial_forest, trap_locations_3, trap_size, caught_pests_3, title=‘View 3’)

Draw the trap next to each subplot

for i, ax in enumerate(axes.flat):
trap_loc = trap_locations_1[i]
draw_best_trap(ax, trap_loc, trap_size)

plt.tight_layout()
plt.show()
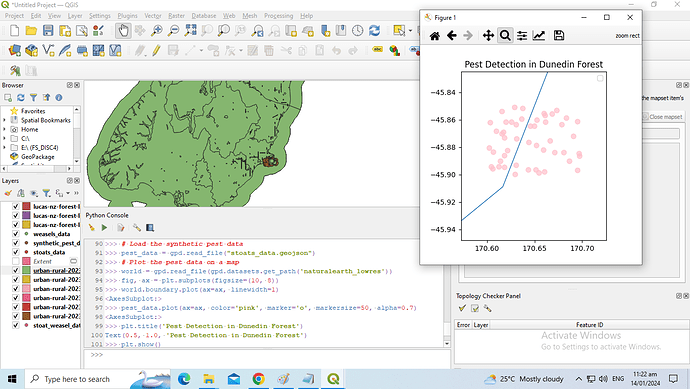
Make sure to adapt this code to your specific data format and detection algorithm. If you have real pest data, replace the synthetic data with the actual data and follow a similar visualization process.

import numpy as np
import matplotlib.pyplot as plt

def create_forest(rows, cols, pest_statistics):
“”“Create a forest with pests based on specified statistics.”“”
forest = np.zeros((rows, cols))
total_cells = rows * cols

for pest_type, stats in pest_statistics.items():
    mean, std_dev = stats
    num_pests = int(np.random.normal(mean * total_cells, std_dev * total_cells))
    num_pests = np.clip(num_pests, 0, total_cells)
    pest_locations = np.random.choice(total_cells, num_pests, replace=False)
    pest_rows, pest_cols = np.unravel_index(pest_locations, (rows, cols))
    forest[pest_rows, pest_cols] = pest_type

return forest

def print_pests_table(forest, trap_locations, trap_size, frequency_band, outside=False):
“”“Print a table of the number of pests inside/outside traps for each pest type.”“”
trap_counts = {1: 0, 2: 0, 3: 0}
total_cells = forest.size

for trap_loc in trap_locations:
    trap_range = trap_size / 2
    trap_row, trap_col = trap_loc
    min_row, max_row = int(trap_row - trap_range), int(trap_row + trap_range + 1)
    min_col, max_col = int(trap_col - trap_range), int(trap_col + trap_range + 1)

    if outside:
        pests_outside_trap = forest[min_row:max_row, min_col:max_col]
        pests_outside_trap = pests_outside_trap[pests_outside_trap > 0]
    else:
        pests_inside_trap = forest[min_row:max_row, min_col:max_col]
        pests_inside_trap = pests_inside_trap[pests_inside_trap > 0]
        for pest_type in trap_counts:
            trap_counts[pest_type] += np.count_nonzero(pests_inside_trap == pest_type)

total_pests = {pest_type: np.count_nonzero(forest == pest_type) for pest_type in trap_counts}

headers = ["Pest Type", "Total Pests", "Trapped Pests"]
rows = []

for pest_type in trap_counts:
    total_pests_count = total_pests[pest_type]
    trapped_pests_count = trap_counts[pest_type]
    rows.append([pest_type, total_pests_count, trapped_pests_count])

print("\nNumber of pests inside traps:")
for row in rows:
    print("{:<12} {:<15} {:<15}".format(*row))

def plot_forest(forest, trap_locations, trap_size, frequency_band, title=‘Forest Scenario’):
“”“Plot the forest using Matplotlib.”“”
fig, ax = plt.subplots(figsize=(10, 8))
cmap = plt.cm.tab10

# Plot pests
im = ax.imshow(forest, cmap=cmap, interpolation='nearest')

ax.set_title(title)
ax.set_xlabel('Columns')
ax.set_ylabel('Rows')

# Highlight traps
for trap_loc in trap_locations:
    trap_range = trap_size / 2
    rect = plt.Rectangle((trap_loc[1] - trap_range, trap_loc[0] - trap_range),
                         trap_size, trap_size, linewidth=2, edgecolor='red', facecolor='none')
    ax.add_patch(rect)

# Add colorbar
cbar = plt.colorbar(im, ax=ax, ticks=list(range(1, 4)), orientation='vertical', pad=0.1)
cbar.set_label('Pest Types')

# Print tables for pests inside and outside traps
print_pests_table(forest, trap_locations, trap_size, frequency_band)

plt.show()

Set simulation parameters

rows, cols = 20, 20

Pest statistics: mean and standard deviation for each pest type

pest_statistics = {
1: (0.05, 0.02),
2: (0.02, 0.01),
3: (0.01, 0.005)
}
trap_size = 5
frequency_band = 0.8 # Probability of trapping with random frequency (adjust as needed)

Create the initial forest with specified pest statistics

initial_forest = create_forest(rows, cols, pest_statistics)

Set trap locations for different views

trap_locations_1 = [(5, 5), (15, 15)]
trap_locations_2 = [(10, 5), (5, 15)]
trap_locations_3 = [(15, 5), (10, 15)]

Plot different views

plot_forest(initial_forest, trap_locations_1, trap_size, frequency_band, title=‘Initial Forest Scenario’)
plot_forest(initial_forest, trap_locations_2, trap_size, frequency_band, title=‘View 1’)
plot_forest(initial_forest, trap_locations_3, trap_size, frequency_band, title=‘View 2’)