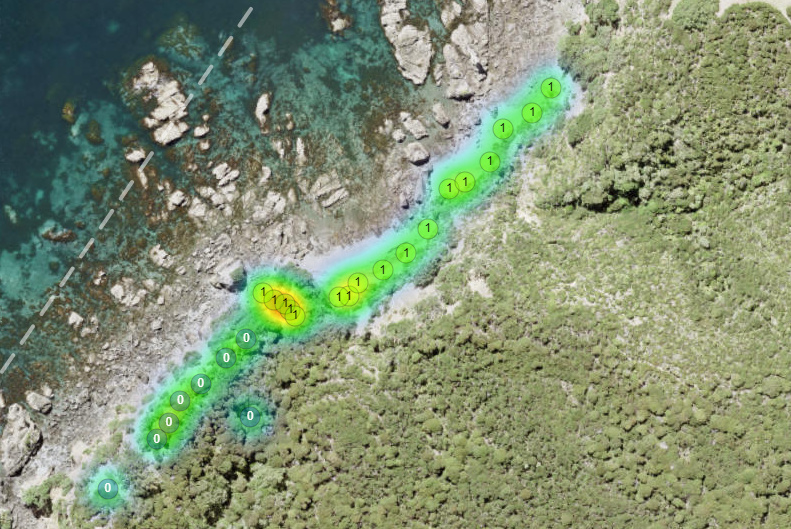
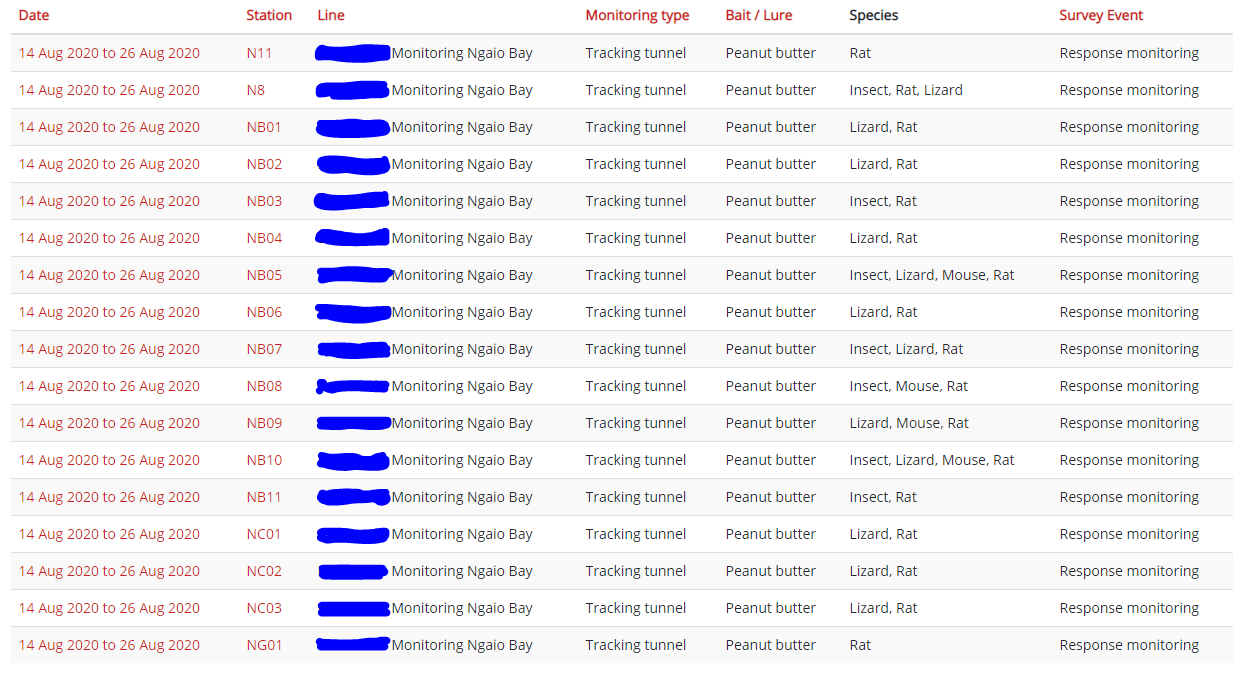
Hi there. I’m trying to generate a monitoring heatmap for a specific date range and target species, but it seems to be pulling in other data as 0 values are giving off a heat signature. there are records of that species outside the date range. Weirdly it’s not pulling in all potential 0 values from that line either.
Hi @amy.waldmann - can you please check again? This should have been fixed now - the report was counting records with no species detected (which wasn’t particularly useful).
Hi @dan - apologies I’m still seeing the same results. I’ve attached images of the search terms I’ve used, and the results. What other information can I provide that might be helpful? I’m using Chrome v85.0.4183.102
I see! Thanks @amy.waldmann - we’ll get onto that now - it looks like the issue was fixed but not actually applied to the live site yet. We’ll post back once it is done.
Hi, is it possible for me to make a heat map which shows my 0 values? I want a map which shows a very strong blue where traps are regularly checked and nothing caught in the same way as it shows a hotter red where more is caught. I guess this is a mix of trapping effort and catch. I’d like to be able to make trappers feel valued for catching nothing in a community trapping setting. If it is possible please point me in the right direction.
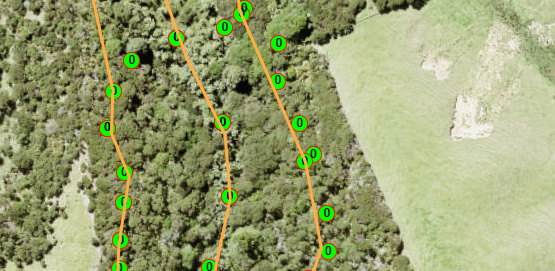
Hi Richard, You can make a map using the “none” filter for trap catches (example below). It won’t be a heat map, but it will show the 0 values. The effort required to catch goes up significantly as density of pests decreases, and provides a great challenge for project leaders to keep individuals and communities motivated as we go towards predator free 2050.