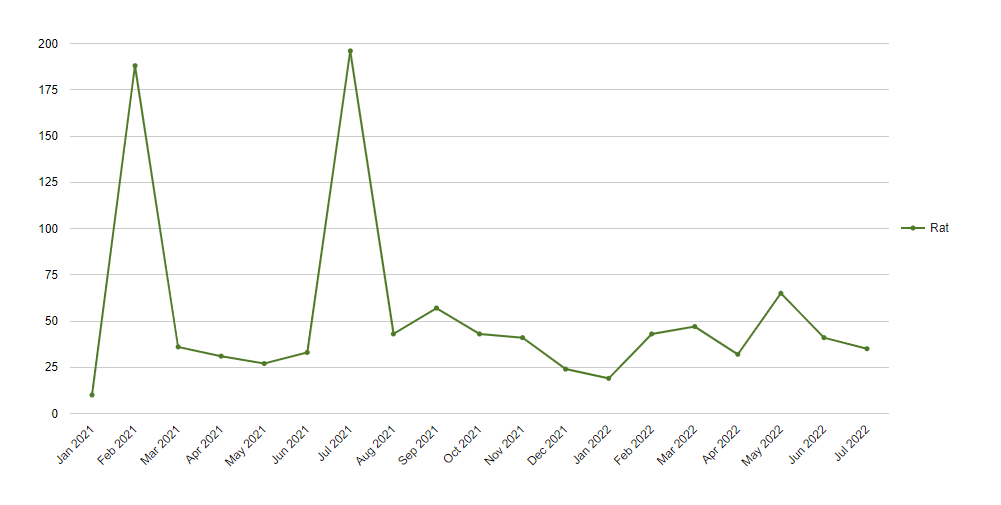
Now, straight away I see we have 2 months where the catch total is around 200. This can not be correct, we simply don’t have that many devices out there.
So I checked the trap records and for both of those months, we caught nothing like that number. In February of 2021 we have 6 records, with 1 catch each - so a total of 6. And in July of 2021 we had 35 records with 1 catch each, so a total of 35 catches.
Can someone check this please? It’s important this report is accurate.
For clarity: Dates as shown. Project is South Titirangi Neighbourhood Network, all lines, all trap types, Species = rat (or the 3 types of rat all selected, doesn’t matter).
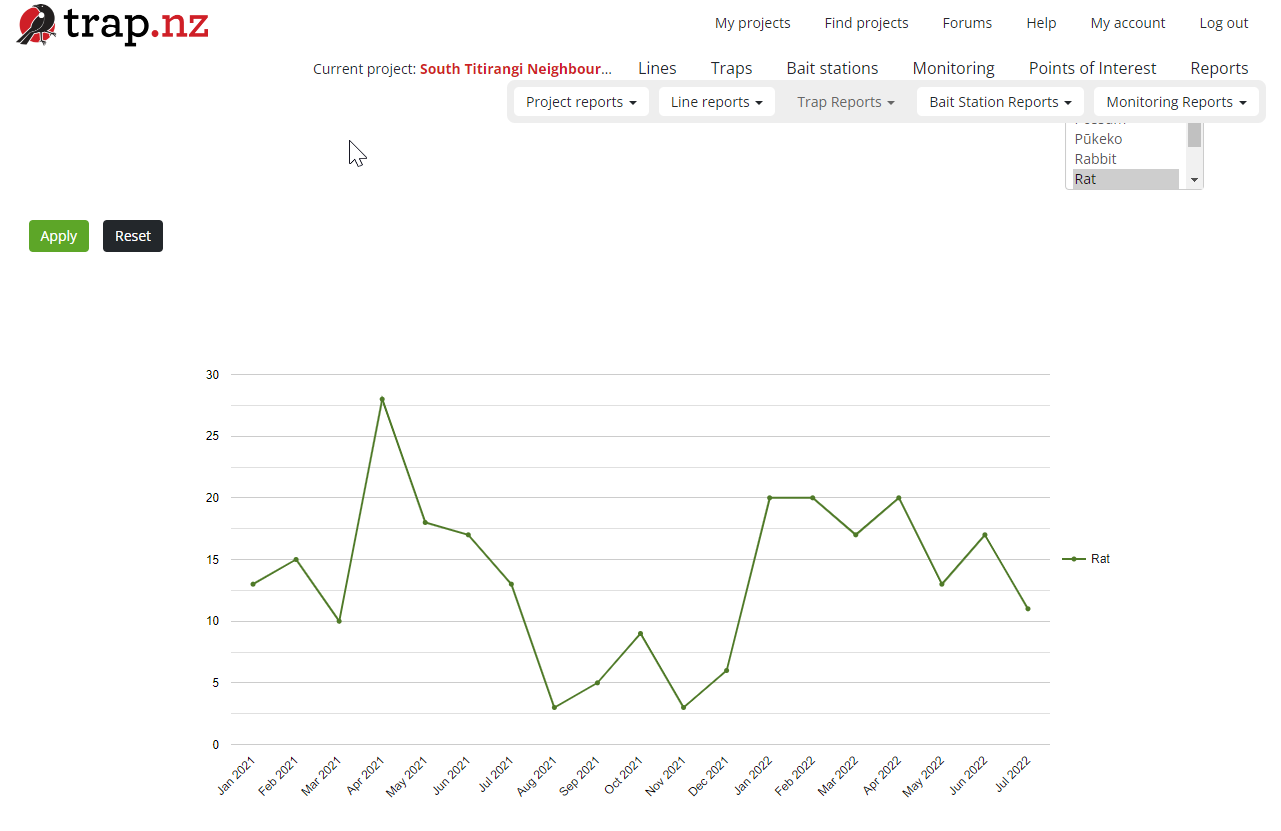
@davo36 I get a totally different chart. I’m wondering if you’ve accidently created a multi- project report this is a screen shot of what I see, is this closer to what you were expecting
Yes, this report has recently been changed to allow reports across multiple projects. The table version of this report already did that, so this update was to bring them in line.