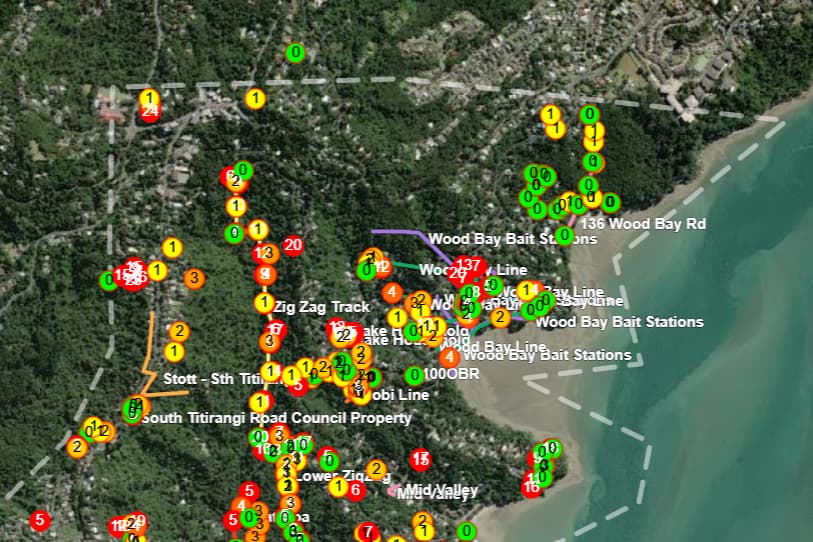
I wanted to sort on strikes, so I could see which traps are catching the most. Note that in the map picture above, there’s one with 20 kills in the middle towards the top.
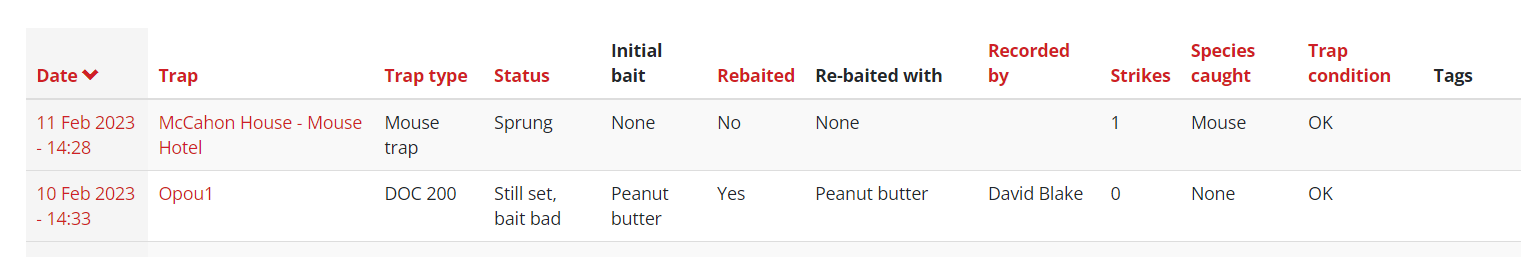
So if I click on the Strikes column to sort on that, the column headings change. The strikes column is no longer there:
So I can’t really use this report to see the traps which are catching the most. Or am I doing something wrong?
Also, another problem/issue. If I click on the ‘Last’ button to move to the last record, I can in fact see the traps with the most catches. The Strikes column is there again. But it’s showing ‘11’ as the highest number of catches. And remember the 20 kills trap from above? Which is correct?
Note that I have selected a date range which is from the beginning of our project till now. 1/9/202 - 13/2/2023. The project is South Titirangi Neighbourhood Network.
First, the disappearing strikes when sort applied is due to a feature we had set on the table of results which hides a column if all the visible rows in the table have no value in that column. We use this feature quite a lot on reports where there could be a lot of optional columns that if empty just take up a lot of space in the tables, and by hiding those columns it makes more room for columns that have values.
It’s a neat and useful trick in many reports, but not in this one. As you noted, if you sort by such a column, it sorts ascending by default, so zero strikes are listed first. Zero is treated as empty, and if all the visible rows are considered empty it hides the column, and now you can no longer click on the column heading to sort in the other direction. It doesn’t make sense to use this feature on this table, and we’ve now fixed this by removing that feature from all of the sortable columns in this table.
Second, the map shows the sum of strikes for each trap over the time period. It finds all the records for that trap over the selected time period and adds the strikes from each record together to get the total which is displayed on the map.
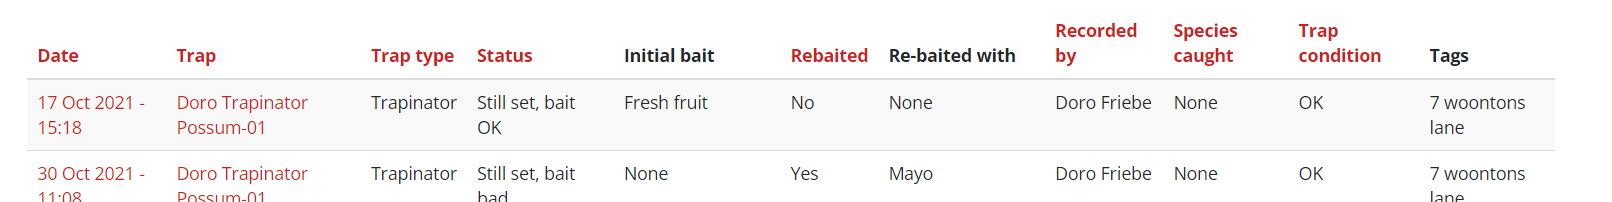
The table of results below the map shows the individual records. So if you sort the results by trap and add the strikes together for each of the records for that trap, you’ll get the total shown on the map.
This does make it tricky if you want to sort by those totals since the sort will order by the highest number of strikes in a single record. If you download the results as CSV you will get the individual records as well, like the table. If that’s what you’re after, you’d be better to take a look at the Catches by Trap report (Catches by trap | Trap.NZ)
I hear what you are saying about not displaying empty columns.- I don’t write code, but zeros are not null.
If your snazzy tool recognised zeros as data, would that fix the issue?